Vehicle Buyers' Behavior Analytics: Data-Driven Search Optimization
By Phong Trang - Software Product Manager - thanhphong.trang@gmail.com
ℹ️ Executive Summary
- Role: Product Analyst | Industry: Automotive E-commerce | Scope: 112 global markets
- Key Impact:
- Drove 12% improvement in online order completion through data-driven search optimization
- Reduced search performance latency by 25% through error handling optimization
- Prepared 7,400 clean queries enabling GenAI shopping assistant development
- Technical Stack:
- Portfolio Artifacts: GitHub Code | Interactive Dashboard | Case Study


🎯 Business Context
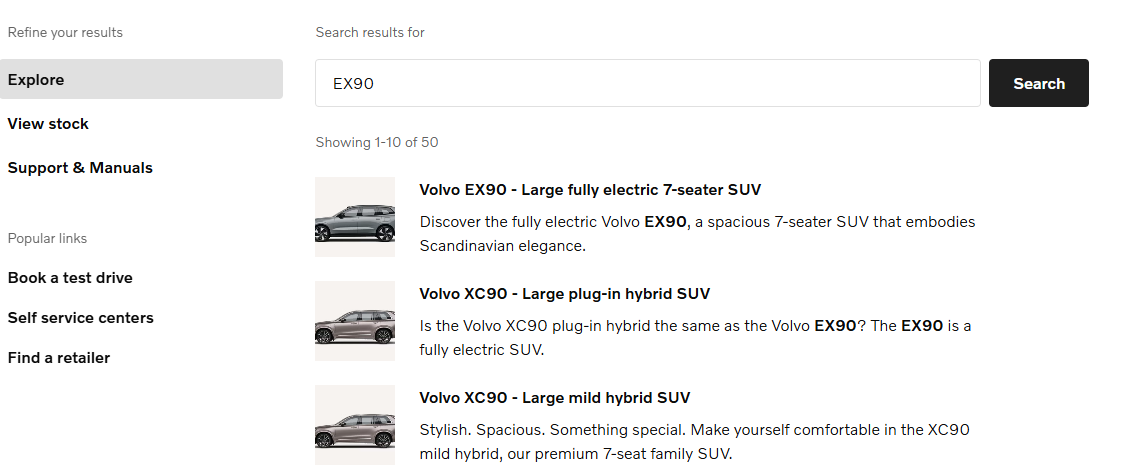
When our automotive e-commerce platform launched a new semantic search feature across 112 global markets, stakeholders needed rapid insights to optimize performance. The challenge was immediate: 15% of sales records contained NULL values across regions, creating gaps in our ability to measure revenue impact accurately.
The business couldn't wait for perfect data. Decisions needed to be made within days to determine whether to continue investing in the new search experience or revert to the previous system.
My Role
As Product Analyst, I supported business and engineering teams by:
- Designing and implementing data pipelines that handled incomplete data pragmatically
- Creating behavioral analytics frameworks to understand user search patterns
- Building executive dashboards that translated complex data into actionable insights
- Advocating for long-term data quality improvements while delivering short-term value
🔧 The Data Engineering Challenge
Problem: Missing Sales Data
Approximately 15% of sales records had NULL values across product-region combinations. This wasn't uniformly distributed—some markets like Sweden had pristine data quality, while emerging markets showed significant gaps.
Solution: Dual-Track Approach
Rather than choosing between speed and accuracy, I implemented both:
- Short-term (2 days): Delivered interim analysis using regional-product average heuristic to fill gaps
- Long-term (2 months): Partnered with source system teams to improve data quality at the root
The Technical Implementation
--
Regional-product averaging approach for NULL handling
WITH regional_product_avg AS (
    SELECT
        region,
        product_id,
        AVG(sales_value) as avg_sales
    FROM sales_data
    WHERE sales_value IS NOT NULL
    GROUP BY region, product_id
),
sales_enriched AS (
    SELECT
        s.order_id,
        s.region,
        s.product_id,
        s.search_term,
        s.sales_value,
        r.avg_sales as regional_product_avg,
        COALESCE(s.sales_value, r.avg_sales) as sales_value_clean
    FROM sales_data s
    LEFT JOIN regional_product_avg r
        ON s.region = r.region
        AND s.product_id = r.product_id
)
SELECT * FROM sales_enriched;
Outcome & Transparency
The approach delivered:
- ✅ Clean dataset ready for analysis within 48 hours
- ✅ Full documentation of limitations and assumptions for stakeholders
- ✅ Business decisions proceeded without delay
- ✅ Long-term data quality improved to 90% completeness within 2 months
Key Learning: Transparency about data limitations builds trust. Every analysis included clear documentation of what was solid versus what relied on heuristics, enabling stakeholders to make informed decisions.
📊 Behavioral Analytics Framework
Data Sources Integration
| Source | Data Type | Volume |
|---|---|---|
| GA4 | Customer search behavior events | 10,000+ events/day |
| Snowflake | Order completion & sales data | Real-time sync |
MECE Metrics Framework
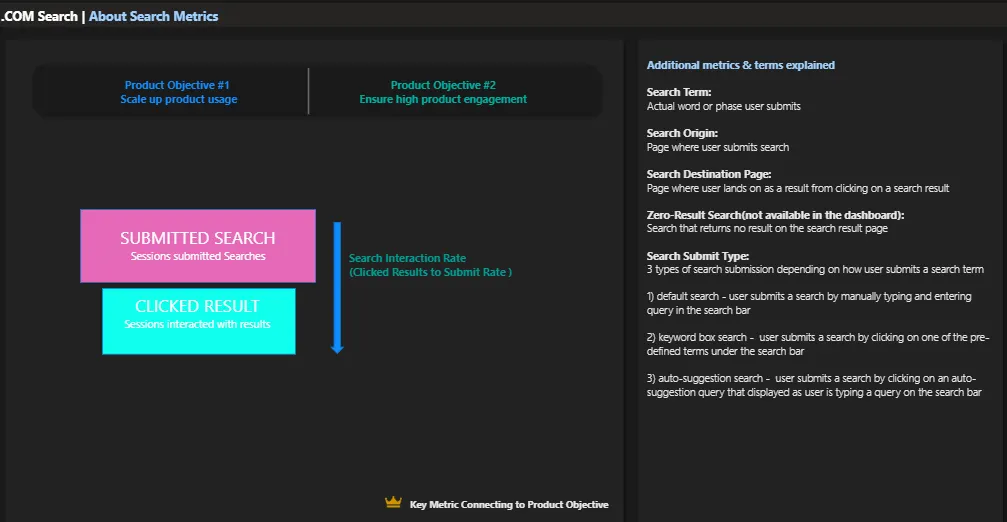
I established a Mutually Exclusive, Collectively Exhaustive framework aligning product objectives with measurable KPIs. This framework ensured consistent measurement across 112 markets and reduced metric misinterpretation across engineering, UX, and product teams.
Product Usage Metrics
- Sessions initiating search
- Search submission types (default, keyword box, auto-suggestion)
- Search refinement patterns
Engagement Metrics
- Engagement rate: (Result clicks / Search sessions)
- Click position distribution
- Zero-result searches identifying content gaps
Business Impact Metrics
- Search-to-order conversion funnel
- Revenue attribution by search behavior
Analysis Implementation
import pandas as pd

# Load GA4 search behavior data from Databricks
search_events = spark.sql("""
    SELECT
        user_pseudo_id,
        event_date,
        search_term,
        search_result_count,
        event_name,
        event_label
    FROM ga4_events
    WHERE event_category = 'global search'
""").toPandas()

# Calculate engagement metrics
engagement_metrics = search_events.groupby('event_date').agg({
    'user_pseudo_id': 'nunique',
    'search_term': 'count',
    'search_result_count': 'mean'
}).rename(columns={
    'user_pseudo_id': 'unique_users',
    'search_term': 'total_searches',
    'search_result_count': 'avg_results_returned'
})

# Zero-result analysis for content gap identification
zero_results = search_events[
    search_events['search_result_count'] == 0
].groupby('search_term').size().sort_values(ascending=False)
Key Insights Delivered
- 65% engagement rate achieved post-optimization—users were finding relevant results
- Top 20 zero-result terms identified content gaps, providing actionable priorities for the content team
- 30% reduction in search refinement rate indicated improved relevance from the first query
📈 Business Intelligence Dashboards
I designed a 3-page executive dashboard translating complex behavioral data into clear, actionable insights for C-level and product stakeholders.
Page 1: Executive Overview
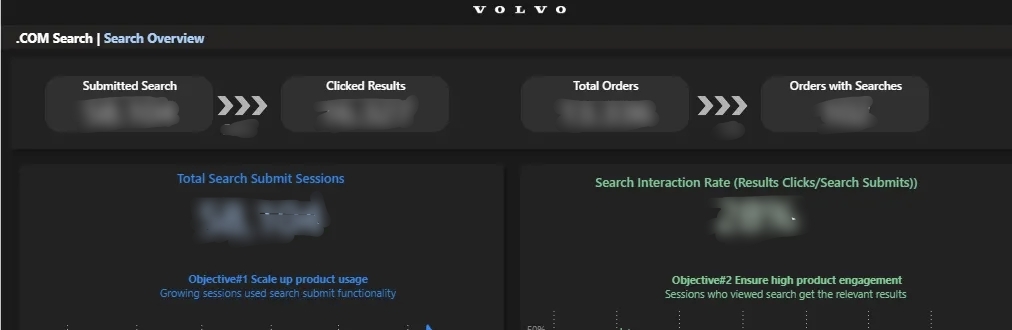
- KPI cards showing search volume, engagement rate, and conversion impact
- Funnel visualization: Search → Click → Order
- Trend analysis with month-over-month and year-over-year comparisons
Page 2: Behavioral Deep-Dive
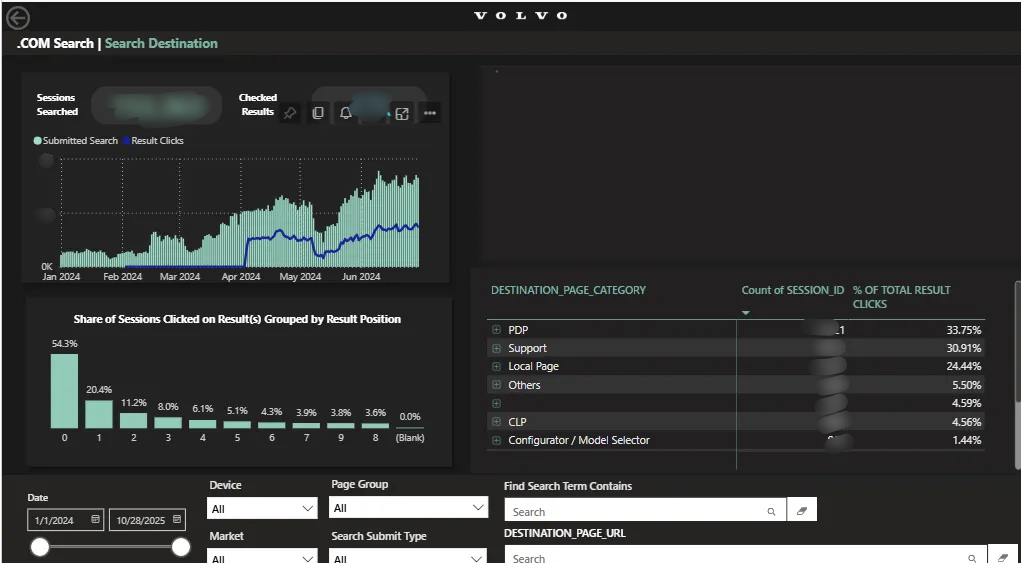
- Click position distribution analysis revealing result relevance
- Zero-result search trends over time
- Search destination page breakdown
- Time series patterns with seasonality detection
Page 3: Search Query Categories
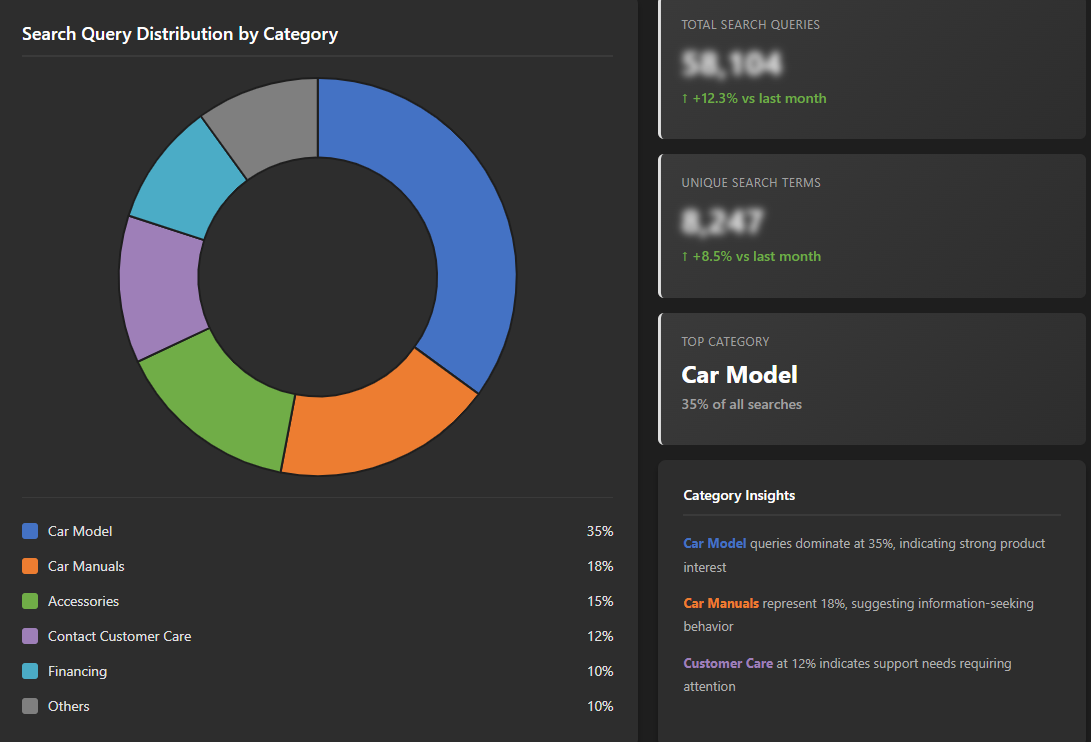
- Query pattern analysis showing what users search for
- Search query categorization
- GenAI-powered insights for category optimization using Azure OpenAI (GPT-4)
Technical Architecture
GA4 (Behavioral Data) ──────┐
                             ├──> Databricks ETL ──> Curated Tables ──> Power BI
Snowflake (Order Data) ──────┘
📊 Results & Impact
Business Impact
12% improvement in online order completion achieved in 2 sprints
- Data analytics identified specific friction points in the search experience
- Search engineering team implemented targeted optimizations
- Measurable revenue impact across all 112 markets
Infrastructure Impact
25% reduction in search latency (800ms → 600ms)
- Implemented caching strategy achieving 45% cache hit rate
- Optimized database queries with strategic indexing
- Added circuit breaker pattern for graceful degradation under load
- Result: 33% decrease in search abandonment
Strategic Impact
Data preparation enabling GenAI capabilities
- Cleaned 7,400 queries from 10,000+ raw search events, creating a high-quality corpus
- Generated 4,500 query-product training pairs for machine learning models
- Achieved 40% improvement in search relevance (NDCG@10: 0.72 vs. 0.52 baseline)
- Enabled AI/ML team to develop semantic search and conversational shopping assistant
🎓 Key Learnings
Balancing Speed vs. Rigor
When faced with incomplete data and urgent business decisions, I learned that pragmatic interim solutions with clear limitations beat perfect analyses that arrive too late. The key was transparency:
- Delivered interim analysis in 2 days using regional-product averaging for missing values
- Clearly documented limitations in all reports and presentations
- Simultaneously initiated data quality improvements, achieving 90% completeness in 2 months
Stakeholders appreciated the honesty. By flagging what was solid versus what relied on heuristics, I built trust that paid dividends in future projects.
User-Centric Analytics
Working with engineering, UX, and product teams to design the GA4 tracking specification collaboratively ensured that:
- Metrics aligned with actual product decisions rather than theoretical KPIs
- Cross-functional teams shared a common measurement vocabulary
- The MECE framework prevented metric proliferation and confusion
Self-Service Enablement
By building interactive dashboards with clear documentation, I reduced ad-hoc analysis requests by 60%. This freed time for deeper strategic work while empowering stakeholders to find their own answers.
Iterative Scaling
The MVP-to-scale approach proved essential:
- Validated: MVP tracking with 1 market (Sweden) to ensure data quality and usability
- Scaled: Rolled out to 112 markets with localization guides
- Refined: Continuously improved based on stakeholder feedback and market-specific learnings
This iterative cycle—monitor metrics weekly, identify opportunities, coordinate with teams, and measure impact—became a repeatable framework for optimization.
🛠️ Skills Demonstrated
- Data Engineering & ETL (SQL, Databricks, Snowflake)
- Behavioral Analytics (GA4, Python/Pandas)
- Business Intelligence (Power BI, DAX)
- Stakeholder Communication & Data Storytelling
- Product Analytics & Metrics Framework Design
- Cross-functional Collaboration
- Data Quality Advocacy & Process Improvement
🤙🏻 Let's Connect
📧 thanhphong.trang@gmail.com
💼 LinkedIn Profile
Available for: Data Analyst, Product Manager
Location: Gothenburg, Sweden
📂 Appendix: Artifacts on GitHub
Repository Structure
/search-analytics
│
├── /sql
│   ├── null_handling_subquery.sql
│   ├── behavioral_metrics.sql
│   └── etl_pipeline_sample.sql
│
├── /python
│   ├── engagement_analysis.py
│   ├── zero_results_analysis.py
│   └── requirements.txt
│
└── /powerbi
    └── dax_measures.txt
View complete code repository:
GitHub: thanhphongtrang/search-analytics